The food delivery industry has grown explosively over the last decade, transforming how millions of people dine and how restaurants operate. Platforms such as DoorDash, Uber Eats, Grubhub, and Postmates (now integrated into the Uber Eats ecosystem) serve as intermediaries that connect hungry customers with local restaurants and independent drivers.
However, food delivery companies’ payment structures can be complex. Understanding restaurant commissions, customer fees, payment terms, and real net revenue is essential whether you’re a restaurant owner evaluating profitability or a customer trying to save money. In this food delivery companies payment comparison, we’ll break down how each platform charges, how revenue flows to restaurants, and how customers are billed, including nuances often overlooked in simpler summaries.
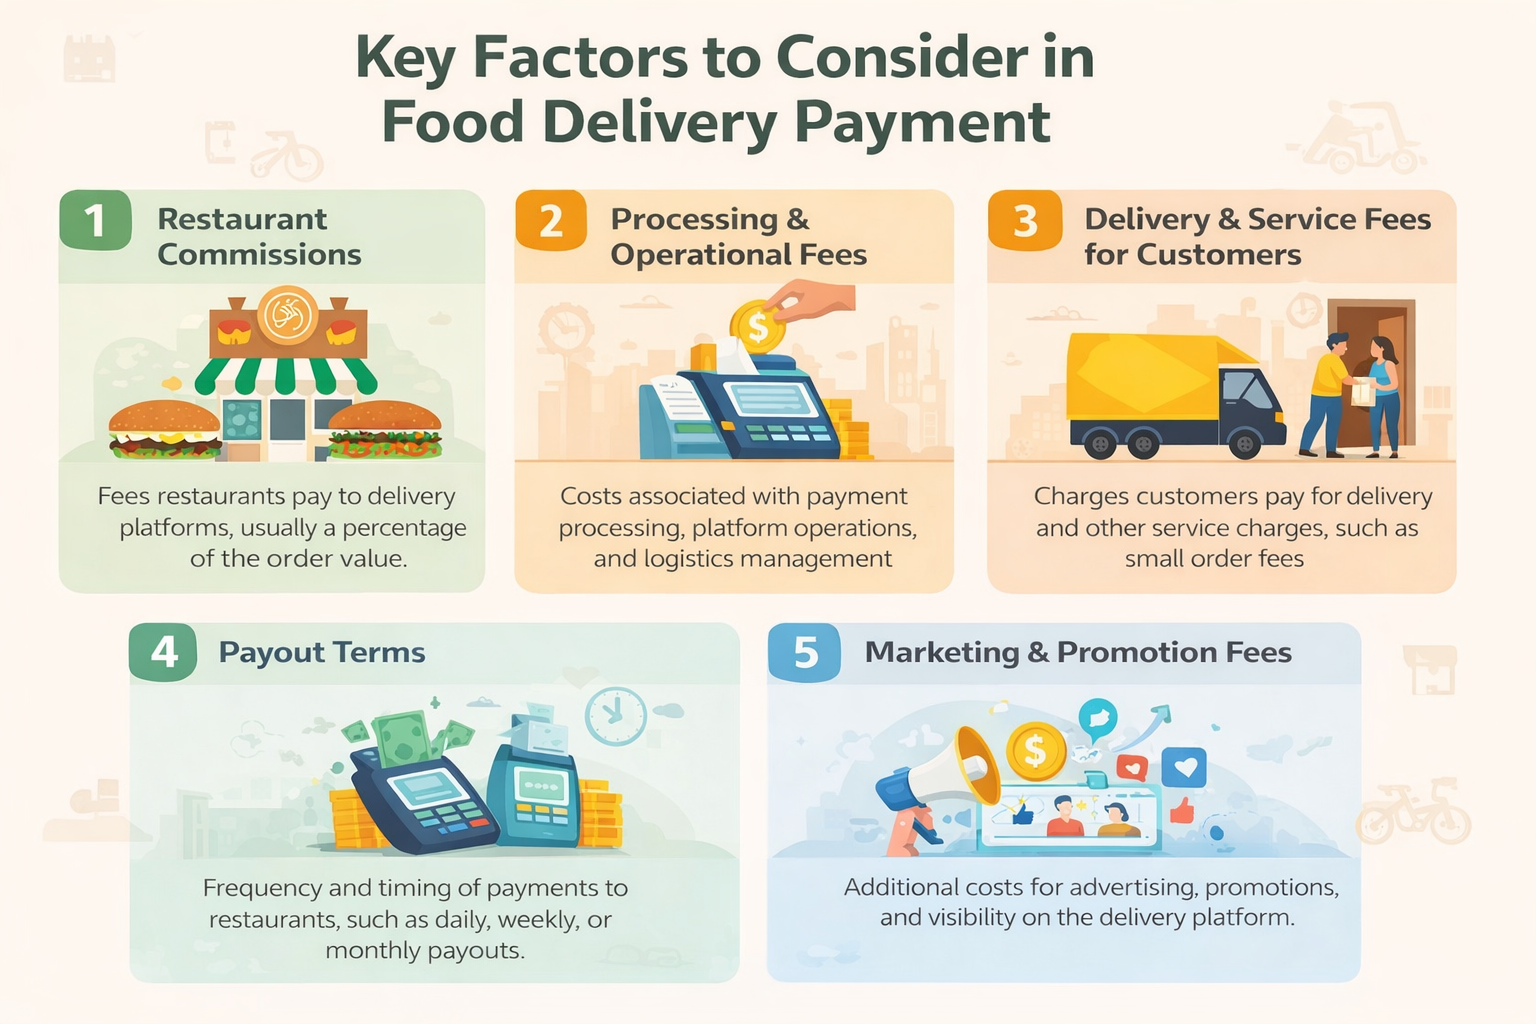
Key Factors to Consider in Food Delivery Payment Comparisons
 Before diving into the best food delivery companies payment comparison, it’s important to understand the core variables that affect costs for both restaurants and customers:
- Restaurant Commissions: Third‑party delivery apps typically charge restaurants a percentage of the order total as commission. These can vary based on plan type and negotiated contract.
- Processing & Operational Fees: In addition to base commission rates, many platforms charge processing or payment‑related fees, which can further reduce restaurant net revenue.
- Delivery & Service Fees for Customers: Customers pay delivery fees, service fees, small‑order fees, and sometimes surge pricing during peak times. These vary widely by location and order details.
- Payout Terms: The timing and method by which restaurants receive payout (weekly, daily advance, or accelerated for a fee) impacts cash flow.
- Marketing & Promotion Fees: Optional promotional services — such as enhanced visibility or priority listing — can increase a restaurant’s overall cost.
1. Delivery Service Fees: How Much Are They Really
Understanding how food delivery platforms charge both restaurants and customers requires moving beyond flat estimates into more realistic ranges based on industry data.
DoorDash
- Restaurant Commissions: Typically around 15 %–30 % per order, depending on which merchant plan the restaurant selects and any promotional add‑ons.
- Additional Costs: Optional fees for marketing or enhanced placement can further increase costs.
- Customer Fees: Delivery and service fees vary significantly by city, market conditions, and order size.
- Payout Options: Restaurants generally receive payouts on a regular schedule, often weekly, but accelerated payout options may be available.
Takeaway: DoorDash’s pricing is variable and context dependent, while commission percentages are broad, actual restaurant costs are shaped by contractual choices and optional services.
Uber Eats
- Restaurant Commissions: Generally within a 15 %–30 % range, though some platforms or plans may have tiered fees depending on services chosen.
- Processing Fees: Some platforms additionally charge processing fees separate from commissions.
- Customer Fees: Delivery and service fees vary by region and can adjust with promotions or dynamic pricing.
- Payout Terms: Typically weekly or at a schedule defined in merchant contracts.
Note: Because Uber Eats has a wide global footprint and diverse plan options, exact costs can differ between markets and individual agreements.
Grubhub
- Restaurant Commissions: Grubhub has been known to offer greater flexibility in commission rates. Some plans range from 5 % to 20 % for its marketplace option or a fixed lower rate for direct orders.
- Processing Fees: May include order processing charges that reduce net income.
- Customer Fees: As with other platforms, delivery and service fees vary by region and time of day.
- Payout Terms: Weekly or negotiated based on partnership agreements.
Takeaway: Grubhub’s structure can be more flexible than others, especially for restaurants that bundle delivery with direct order services.
Postmates (Now Integrated with Uber Eats)
- Restaurant Commissions: Since becoming part of the Uber Eats ecosystem, Postmates typically aligns with Uber Eats pricing structures.
- Customer Fees: Similar to Uber Eats, with variability based on market factors.
2. Are Delivery Platforms Always Cheaper for Customers
There is no single cheapest food delivery app, as costs can vary greatly depending on the location, restaurant partnerships, and the specific items ordered.
Real‑World Pricing Variability
Data suggests that which app is cheapest depends heavily on location, restaurant partnerships, and the specific items ordered:
- A recent analysis found that Grubhub was the lowest‑cost option in most U.S. states when comparing popular fast‑food menu items.
- However, in some metropolitan areas and specific chains, DoorDash and Uber Eats can be cheaper.
- Overall, dynamic fees and promotions mean price comparison at checkout is the only way to know which is cheapest for a particular order.
Why Costs Vary
- Menu prices: Restaurants may price items differently across platforms.
- Delivery & service fees: These can change with surge demand and time of day.
- Promotions & subscriptions: Loyalty programs may reduce or waive fees.
Ultimately, order totals can vary significantly even for the same restaurant and the same meal, so customers should compare options before finalizing an order.
3. What Do Restaurants Actually Earn from Delivery
Restaurants generally have lower profit margins on delivery orders than on dine‑in due to the added commissions and fees.
Typical Profit Impact
- Most third‑party platforms charge 15 % to 30 % commission fees on delivery orders.
- After additional processing and marketing fees, real net margins on delivery orders can shrink substantially, some industry analyses suggest margins fall to 5 %-10 %, much lower than typical dine‑in margins.
This means that while delivery orders can boost sales volume and reach new customers, they often deliver less net profit compared to dine‑in sales.
Negotiated Rates
High‑volume restaurants may negotiate lower commission rates — for example, 18 % to 22 % — especially when they bring significant order volume to a platform.
Hidden and Indirect Costs
Some industry analysts suggest that when factoring in all indirect costs such as payment processing, order handling, and channel marketing, the effective cost of delivery to a restaurant can exceed the advertised commission rate.
4. Restaurant Payout Frequency & Cash Flow
Payout timing varies by platform and by merchant agreement:
- Weekly payouts are common.
- Accelerated or daily payouts may be available for an additional fee or as part of premium plans.
- Some services offer adjusted payout terms for high‑volume partners.
Faster payout options can help restaurants manage cash flow but may come at a cost.
5. Marketing, Promotions & Visibility Costs
Beyond standard commission fees, all of the major delivery platforms offer optional promotional services:
- Featured placement in search results or app banners
- Discounted meal campaigns, which the platform may subsidize
- Subscription benefits for customers that may change restaurant visibility
These services can generate additional orders but increase effective delivery costs for restaurants.
Summary: How the Platforms Compare
| Platform | Commission Range | Customer Fee Variability | Notes |
| DoorDash | ~15 %–30 %+ | High (dynamic & regional) | Optional marketing add‑ons increase costs. |
| Uber Eats | ~15 %–30 %+ | High (dynamic & promotional) | Global reach, varied partnerships. |
| Grubhub | ~5 %–20 % | Variable | Flexible commission structures. |
| Postmates | Aligns with Uber Eats | Variable | Part of Uber Eats system. |
Note: There are no fixed universal fees — negotiation, market, and plan structure play major roles.
Build Your Own Food Delivery App with Qualix Solutions
As the food delivery industry continues to grow, many businesses are looking to create their own platforms to capitalize on the demand. At Qualix Solutions, we specialize in developing custom food delivery apps tailored to your business needs. Whether you’re looking to optimize restaurant commissions, integrate flexible payment options, or create a seamless user experience, our team can help you build a robust solution that’s both user-friendly and scalable.
If you’re considering entering the food delivery market or improving your existing service, contact us today to discuss how we can help you create a food delivery app that stands out.
Conclusion
Choosing the best food delivery companies payment comparison requires understanding complex and variable fee structures for both restaurants and customers. There is no universally cheapest app or lowest commission, real costs depends on contracts, location, order size, and dynamic pricing strategies.. Restaurants must weigh visibility and incremental revenue against lower margins and higher costs, while customers should always compare final order totals before ordering to find the best deal. By grounding decisions in real data and current industry trends, restaurants and consumers can navigate the food delivery ecosystem more effectively and make choices that align with their financial priorities.
FAQs
Which food delivery app is cheapest for customers?
There’s no single cheapest app across all orders. Prices vary by region, restaurant, and time, so customers should compare totals at checkout.
Do delivery platforms always charge the same commission?
No, commissions vary by plan type, restaurant size, and negotiated agreements.
Do restaurants make more profit from delivery than dine‑in?
Generally no; high delivery commissions and processing fees often reduce profit margins relative to dine‑in orders.
Can restaurants negotiate lower fees?
Yes, especially high‑volume restaurants, which can sometimes negotiate lower commission tiers.
Are customer delivery fees fixed?
No, delivery and service fees vary by market, order conditions, and promotional activity.
Relevant Guides & Services

Naveed Ahmed is the founder of Qualix Solutions, a custom software and AI solutions company helping founders and operations leaders turn complex business problems into reliable, scalable software. A former Microsoft Technical Leader with 17 years at the company, Naveed held roles spanning software development management, technical product management, data architecture, and information architecture, delivering platforms for deal management, services product data, SAP integration, and workforce skills systems.
At Qualix, he leads a distributed team building SaaS products, web and mobile applications, AI and machine learning solutions, intelligent automation, and data engineering platforms for clients across professional services, healthcare, and telecommunications. Naveed writes about custom software development, AI solutions for mid-market businesses, product strategy, SaaS architecture, and the operational realities of running a modern software company.