5 Stages of the CRM Maturity Model – Where Does Your Business Stand?

A modern infographic showcasing the 5 stages of the CRM Maturity Model, from Initial (Basic Integration) to Optimized (Personalized Customer Experience), illustrating the evolution of CRM systems from basic to data-driven and AI-powered tools.
 

CRM systems are essential for enhancing customer satisfaction and driving revenue growth. However, simply having a CRM in place isn’t enough; businesses must assess how effectively they’re using it to unlock its full potential. The CRM maturity model helps evaluate and optimize CRM practices at every stage.

By understanding where your business stands on the CRM maturity scale, you can identify gaps and take actionable steps to improve customer interactions, align your CRM with business goals, and maximize your investment.

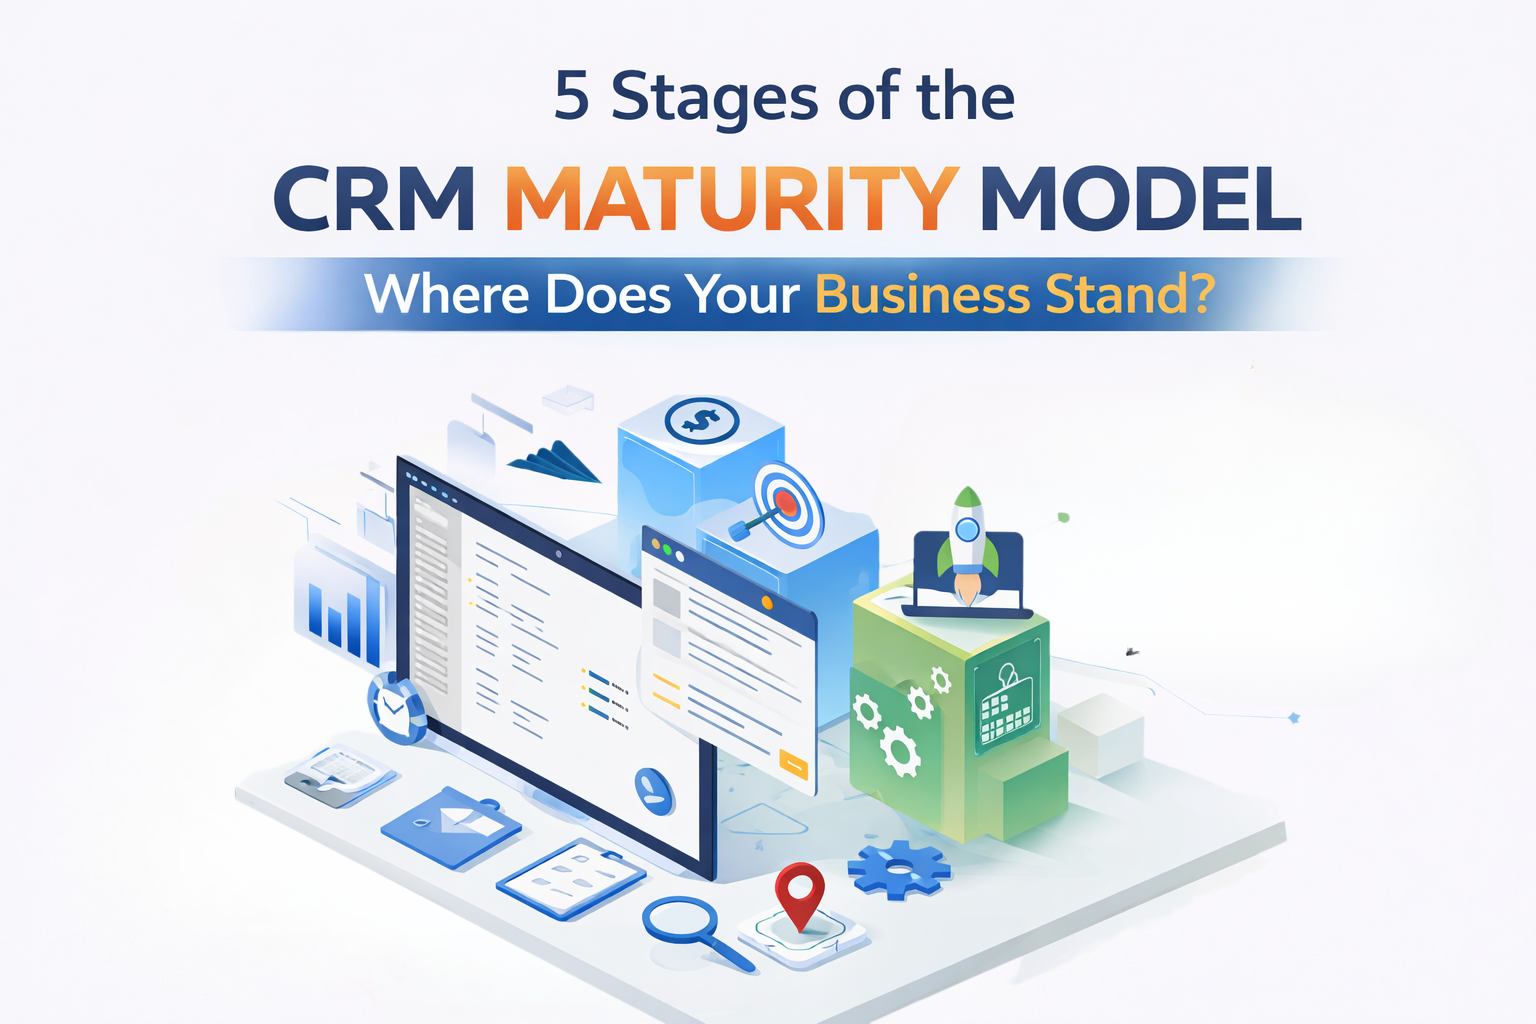
Overview of the CRM Maturity Model

A modern infographic showcasing the 5 stages of the CRM Maturity Model, from Initial (Basic Integration) to Optimized (Personalized Customer Experience), illustrating the evolution of CRM systems from basic to data-driven and AI-powered tools.

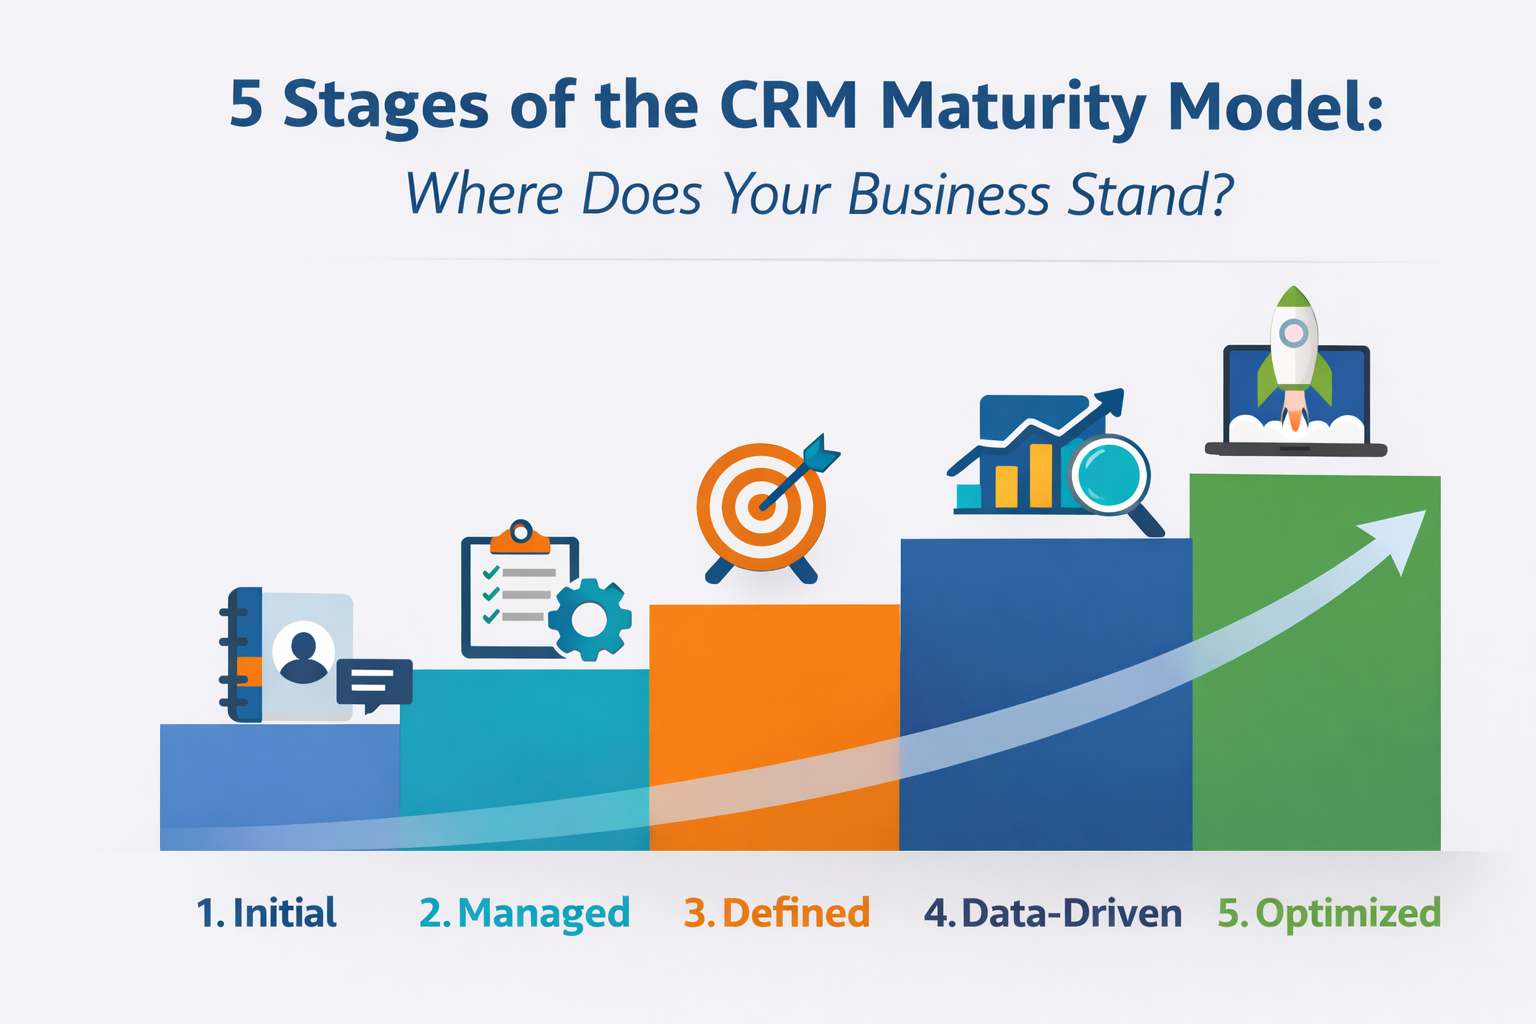
The CRM maturity model maps how effectively businesses use customer relationship management technology and processes. It progresses from simple contact storage to strategic relationship development that directly impacts revenue.

This framework isn’t about software features but about organizational capability. Two companies with identical CRM platforms can operate at completely different maturity levels based on how they use the system and align processes with business goals.

A proper CRM maturity assessment evaluates your current state across people, processes, and technology, identifying specific actions needed to move forward.

Stage 1: Initial/Ad Hoc Approach

At the first stage, your business likely relies on basic systems that lack structure or integration. Many companies in this phase use rudimentary tools like spreadsheets or free software to track customer information. There is little to no automation or strategic planning behind these efforts.

Characteristics:

  • Basic Tracking: Businesses may track contact details or basic customer interactions, but there’s no centralized system for managing this information.
  • Siloed Data: Customer data is often scattered across different systems or even physical files, making it difficult to have a comprehensive view of each customer.
  • Manual Processes: Inefficiencies can arise as most task is done manually.

Challenges:

  • Inconsistent Information: Without a centralized system, it’s hard to ensure that all customer data is accurate and up to date.
  • Limited Visibility: It’s difficult to get a complete view of customer interactions, which means opportunities for improving customer service and engagement may be missed.

Assessment:

If your business finds itself in this stage, it’s essential to move toward a more structured approach. Centralizing your customer data and automating some basic processes will help streamline efforts and make your team more efficient.

Stage 2: Managed Approach

As your business matures, it begins to formalize its approach to managing customer data. At this stage, systems are more structured and efficient, but they may still be limited in scope. There is a clearer understanding of the importance of customer data, and businesses start to implement systems to track more than just basic details.

Characteristics:

  • Structured Tools: Companies start using more robust systems that provide better ways to organize customer information, even if these tools are not yet fully integrated across the business.
  • Process Formalization: Basic workflows and processes are established to handle customer data, though automation may still be in its early stages.
  • Improved Reporting: Businesses can generate reports to track performance, but insights may still be limited to basic metrics.

Challenges:

  • Data Gaps: While data is more organized, there might still be gaps or redundancies that prevent businesses from getting a full understanding of their customers.
  • Limited Integration: Departments may still work in silos, with different teams using separate systems that don’t communicate with one another.

Assessment:

At this point, you’ve moved beyond basic tracking and are starting to develop a more strategic approach. To reach the next stage, your focus should shift to integrating your systems and improving your ability to derive insights from the data you’ve collected.

Stage 3: Defined Strategy

At this stage, businesses have fully implemented systems that integrate with other key functions like sales, marketing, and customer service. A clear customer engagement strategy is in place, and departments are aligned on using data to improve the customer experience. There’s more focus on optimization and refining processes.

Characteristics:

  • Cross-Department Integration: Your system is now integrated across multiple departments, allowing for a seamless flow of customer data and better collaboration between teams.
  • Strategic Use of Data: Businesses use customer data not just for tracking, but to inform marketing campaigns, sales strategies, and service improvements.
  • Standardized Processes: Clear workflows are in place to ensure consistency across customer interactions, whether through sales, customer support, or marketing efforts.

Challenges:

  • Customization: Your system might still require some customization to meet the specific needs of your business.
  • Ongoing Data Quality: Ensuring that the data is high-quality and relevant requires continuous attention and management.

Assessment:

If your business has reached this stage, you’ve begun using your systems to drive decision-making and customer engagement. However, to truly optimize, your next focus should be on advanced analytics and personalization.

Stage 4: Data-Driven Approach

The Data-Driven stage is where your business starts to harness the power of advanced analytics. This is where you can predict customer behavior, identify trends, and optimize your processes based on real-time insights. Technology like machine learning and artificial intelligence begins to play a role in decision-making.

Characteristics:

  • Advanced Analytics: Your systems are not just collecting data but actively analyzing it to uncover insights that can drive strategic decisions.
  • Personalized Interactions: With a deeper understanding of customer behavior, businesses can tailor their messaging, product recommendations, and overall customer experience.
  • Real-Time Insights: Data is collected and analyzed in real-time, allowing businesses to make immediate, informed decisions.

Challenges:

  • Scalability: While predictive analytics can be incredibly useful, scaling these systems to handle large amounts of data can be challenging.
  • Data Governance: With an increasing volume of data, maintaining its quality and security becomes crucial.

Assessment:

At this stage, your business is highly focused on data to improve decision-making and customer interactions. Your next challenge is to ensure that all systems and processes scale effectively to keep up with the growing amount of data and customer needs.

Stage 5: Optimized Customer Experience

The final stage represents the pinnacle of CRM maturity. Here, businesses have fully integrated systems that provide a seamless experience across all customer touchpoints. Everything from marketing to sales to service is data-driven, and customers receive a highly personalized experience tailored to their unique needs. These businesses are continually optimizing and innovating, ensuring they stay ahead of the curve.

Characteristics:

  • Holistic Customer Experience: Your systems are fully integrated, and customer data is used across all departments to deliver a seamless, personalized experience.
  • AI and Automation: Advanced AI technologies predict customer behavior and automate processes to provide instant, highly personalized responses.
  • Continuous Improvement: Systems are continuously optimized based on insights and feedback to ensure that customer engagement is always evolving.

Challenges:

  • Innovation: In order to stay at the top, businesses must continuously innovate, ensuring that the tools and strategies in place remain effective.
  • Data Privacy: As customer data usage increases, businesses must stay vigilant about security and privacy concerns.

Assessment:

If your business is at this stage, you are likely a leader in customer engagement and are reaping the rewards of highly optimized systems. The key here is to maintain your momentum by staying ahead of technological trends and keeping your systems adaptable.

Essential Tactics for Advancing Your CRM Strategy

A modern infographic illustrating three key steps to business growth: Assess your current position, Invest in the right tools, and Integrate across functions, with clear icons and a professional design showing the path to business success.

No matter where you stand, it’s important to recognize that moving from one stage to the next requires a clear plan and a commitment to continuous improvement. Here are a few strategies for advancing through the stages:

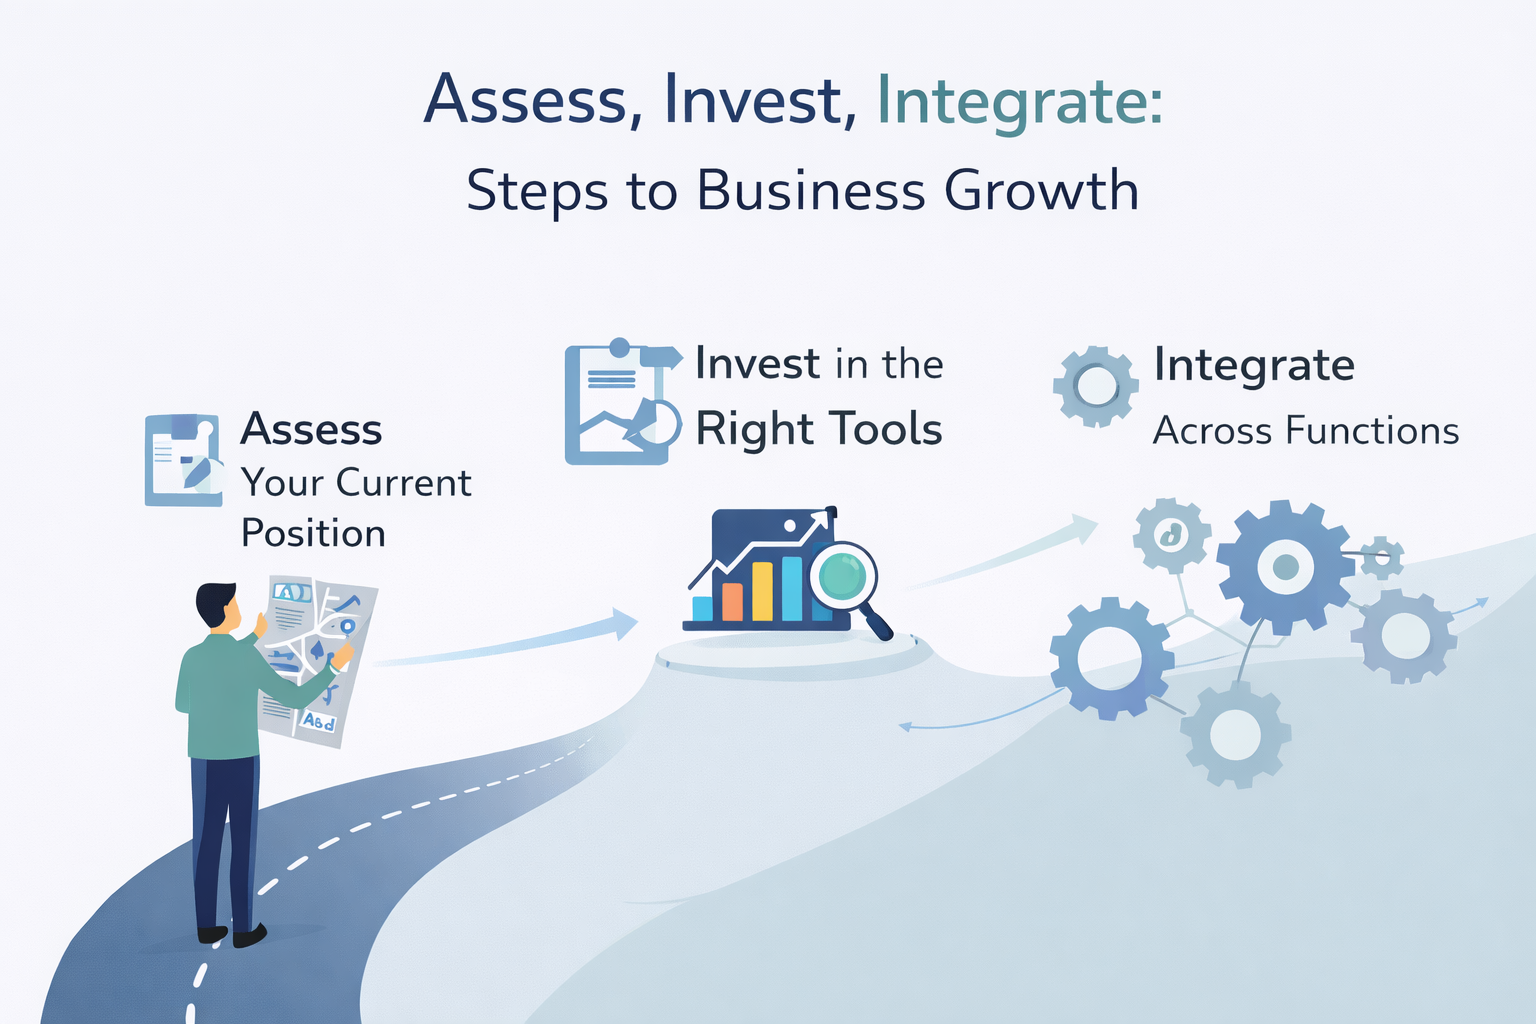
  1. Assess Your Current Position: Take the time to evaluate where you currently stand in the CRM maturity model. Identify the gaps in your current processes and set clear goals for what you want to achieve.
  2. Invest in the Right Tools: As your business grows, so do your needs. Invest in tools that align with your current goals and are scalable as you move forward.
  3. Focus on Data Quality: Data is at the core of every CRM strategy. Ensure your data is accurate, consistent, and up to date.
  4. Enhance Personalization: Begin using the insights you gather from customer data to personalize interactions and create more meaningful relationships.
  5. Integrate Across Functions: Ensure all teams are using the same systems and data to create a consistent and seamless experience for customers.

Conclusion

The CRM Maturity Model provides a clear roadmap for businesses looking to improve their customer engagement strategies. By understanding where your business currently stands, you can take actionable steps to move forward and create a more effective and data-driven approach to managing customer relationships. Whether you’re at the beginning stages or already optimizing your systems, remember that continuous improvement is the key to unlocking the full potential of your customer management tools.

Remember that CRM maturity is a journey, not a destination. The goal isn’t reaching perfection, it’s building sustainable processes for continuous improvement that compound over time.

Ready to advance your CRM maturity? Qualix Solutions helps businesses assess their current stage and build practical roadmaps for improvement that deliver measurable revenue impact. Contact us to discover where you stand and what’s possible.

FAQs

How long does it take to progress from one stage to the next in the CRM maturity model?

Typical progression takes 6-18 months depending on company size and resource commitment. Rushing creates instability, while excessive delays means missing revenue opportunities from better customer management.

Can a small business benefit from understanding the CRM maturity model?

Small businesses often advance faster through early stages because they have fewer people to coordinate and simpler processes to standardize. The maturity model helps avoid overbuying technology and focus investments where they’ll drive the most value.

What’s the difference between CRM maturity and CRM adoption?

CRM adoption measures how many people use the system. CRM maturity assesses how effectively the organization leverages CRM to achieve business objectives—you can have high adoption but low maturity if users just enter data without extracting insights.

Do all businesses need to reach stage five of the CRM maturity model?

No, optimal maturity depends on your business model and competitive position. A local service business may thrive at stage three, while an enterprise SaaS company needs stage four or five capabilities to win deals.


Relevant Guides & Services

Custom Mobile App Development

.Net Development Company

Custom Web Development

UI/UX Design

Next.JS Development Company

Tags

What do you think?

Leave a Reply

Your email address will not be published. Required fields are marked *

Related articles

what is software development

What Is Software Development? Processes, Types, and Business Benefits for Startups & Enterprises

Is your company’s digital infrastructure merely keeping the lights on, or is it engineered to drive explosive growth? Software development drives one of the fastest-growing sectors in the global economy. Industry reports from Grand View Research estimate the market at over $730 billion in 2024, with projected growth exceeding $1.3 trillion by 2030 at an annual rate of more than 11%. For organizations across the United States, mastering this lifecycle is non-negotiable. It turns vague ideas into precise, functional tools that meet specific business goals and user demands. Modern teams rely on structured frameworks, like the Software Development Life Cycle (SDLC). These interconnected steps ensure every line of code serves a strategic purpose. By leveraging agile methodologies and continuous testing, businesses build scalable, secure systems. These systems deliver long-term value and a formidable competitive edge. This guide breaks down the core processes, various application types, and tangible benefits professional software development brings to ambitious companies. The increasing reliance on software across industries, from cloud computing to artificial intelligence, continues to drive massive global investment, with enterprise software spending expected to approach $1 trillion annually, according to data from Statista. Key Takeaways Software development is a structured process for creating and maintaining digital applications. It powers a massive and rapidly growing global economy. A defined lifecycle (SDLC) is crucial for aligning technical work with business strategy. Modern methodologies help build scalable and secure systems for the future. Professional development transforms digital infrastructure into a key driver of business value. Understanding different software types is essential for selecting the right solution. The ultimate goal is to create efficient tools that meet specific user and organizational needs. Introduction to Software Development The modern business landscape is fundamentally shaped by programmable systems that operate independently of physical machines. These digital instructions form the backbone of everything from utility grids to personal devices. This foundational layer enables the creation of tailored applications. Companies leverage these tools to carve out unique market positions. Setting the Stage for Digital Innovation Digital innovation thrives on automation. Complex tasks are handled by code, allowing operations to scale efficiently. Manual labor costs no longer rise proportionally with growth. This efficiency drives the current 11.7% annual market growth in the United States. The Role of Software in Modern Business Modern enterprises use applications to integrate disparate systems. Seamless data flow between departments boosts organizational efficiency. The role of these programs has evolved. Simple utilities have become complex, cloud-native ecosystems supporting millions of businesses daily. Aspect Traditional Approach Software-Driven Approach Primary Impact Data Management Manual filing, spreadsheets Centralized databases, real-time analytics Faster, accurate decisions Process Automation Repetitive human tasks Automated workflows, bots Lower costs, higher output Customer Interaction In-person, phone calls 24/7 digital portals, apps Improved service, global reach This shift underscores why professional software development is critical. It transforms static infrastructure into a dynamic engine for value creation. What is Software Development: Definition and Scope The global demand for digital solutions underscores the importance of a well-defined creation process. This field involves the comprehensive steps of defining, building, testing, and maintaining applications. It supports a market valued at $429 billion. Understanding the Core Concepts Software engineers and developers collaborate closely. They translate complex business needs into functional code. The final product must align with user expectations. The scope of this work is broad. It includes system, application, and embedded programs. Each type requires specialized programming languages and tools. Effective planning and requirements management are critical. Teams define the project scope before writing a single line. This upfront work prevents costly changes later. Type Primary Function Common Tools & Languages Typical Use Case System Software Manages hardware and basic operations C, C++, Assembly Operating systems, drivers Application Software Performs specific tasks for users Java, Python, JavaScript Web apps, mobile apps, business tools Embedded Software Controls dedicated hardware devices C, Rust, specialized IDEs Medical devices, automotive systems A structured approach ensures products are secure and maintainable. This methodology delivers long-term value throughout the entire lifecycle. The Software Development Lifecycle (SDLC) Explained A structured framework guides every successful project from initial concept to long-term support. This lifecycle, known as the SDLC, provides a roadmap for teams to build robust applications. It standardizes the development process to enhance quality and manage risk. Following these phases ensures the final product aligns with business goals. SDLC Stages: Planning to Maintenance The software development process typically involves seven key phases: Planning: Defining project scope and objectives. Analysis: Gathering detailed requirements. Design: Creating system architecture. Implementation: Writing the actual code. Testing: Identifying and fixing bugs. Deployment: Releasing the application to users. Maintenance: Providing updates and support. Each stage feeds into the next, creating a logical flow. Software engineers rely on this sequence to embed security and scalability early. Best Practices and Process Optimization Modern teams integrate continuous testing throughout the lifecycle. This approach catches defects long before deployment. Regular feedback loops with stakeholders are crucial. They ensure the product evolves according to user needs. Standardizing the deployment maintenance cycle leads to predictable outcomes. It also helps developers meet regulatory requirements efficiently. Comparing Development Methodologies The 2001 Agile Manifesto marked a pivotal shift in how engineers approach complex projects. Teams now select from several established models to guide their work. Each framework offers distinct advantages for managing scope, risk, and delivery. Agile vs Waterfall: Key Differences and a Comparison Table The Waterfall model is a linear, sequential approach. Each phase, like planning or design, must finish before the next begins. This method suits projects with highly stable, well-defined requirements. Changes later in the process are difficult and costly. Agile methodology prioritizes flexibility and customer feedback. Work occurs in short, iterative cycles called sprints. This allows teams to adapt quickly to new information or shifting priorities. It is ideal for dynamic environments. Aspect Waterfall Model Agile Methodology Ideal Project Type Approach Linear & Sequential Iterative & Cyclical Waterfall: Stable specs. Agile: Evolving needs. Flexibility Low; changes are costly High; adapts each sprint Waterfall: Fixed contracts. Agile: Market-driven. Customer Involvement Mainly

Read more
food delivery bicycle courier passing urban restaurant

Food Delivery Companies Payment Comparison 2026

The food delivery industry has grown explosively over the last decade, transforming how millions of people dine and how restaurants operate. Platforms such as DoorDash, Uber Eats, Grubhub, and Postmates (now integrated into the Uber Eats ecosystem) serve as intermediaries that connect hungry customers with local restaurants and independent drivers. However, food delivery companies’ payment structures can be complex. Understanding restaurant commissions, customer fees, payment terms, and real net revenue is essential whether you’re a restaurant owner evaluating profitability or a customer trying to save money. In this food delivery companies payment comparison, we’ll break down how each platform charges, how revenue flows to restaurants, and how customers are billed, including nuances often overlooked in simpler summaries. Key Factors to Consider in Food Delivery Payment Comparisons Before diving into the best food delivery companies payment comparison, it’s important to understand the core variables that affect costs for both restaurants and customers: Restaurant Commissions: Third‑party delivery apps typically charge restaurants a percentage of the order total as commission. These can vary based on plan type and negotiated contract. Processing & Operational Fees: In addition to base commission rates, many platforms charge processing or payment‑related fees, which can further reduce restaurant net revenue. Delivery & Service Fees for Customers: Customers pay delivery fees, service fees, small‑order fees, and sometimes surge pricing during peak times. These vary widely by location and order details. Payout Terms: The timing and method by which restaurants receive payout (weekly, daily advance, or accelerated for a fee) impacts cash flow. Marketing & Promotion Fees: Optional promotional services — such as enhanced visibility or priority listing — can increase a restaurant’s overall cost. 1. Delivery Service Fees: How Much Are They Really Understanding how food delivery platforms charge both restaurants and customers requires moving beyond flat estimates into more realistic ranges based on industry data. DoorDash Restaurant Commissions: Typically around 15 %–30 % per order, depending on which merchant plan the restaurant selects and any promotional add‑ons.  Additional Costs: Optional fees for marketing or enhanced placement can further increase costs.  Customer Fees: Delivery and service fees vary significantly by city, market conditions, and order size.  Payout Options: Restaurants generally receive payouts on a regular schedule, often weekly, but accelerated payout options may be available. Takeaway: DoorDash’s pricing is variable and context dependent, while commission percentages are broad, actual restaurant costs are shaped by contractual choices and optional services. Uber Eats Restaurant Commissions: Generally within a 15 %–30 % range, though some platforms or plans may have tiered fees depending on services chosen. Processing Fees: Some platforms additionally charge processing fees separate from commissions. Customer Fees: Delivery and service fees vary by region and can adjust with promotions or dynamic pricing.  Payout Terms: Typically weekly or at a schedule defined in merchant contracts. Note: Because Uber Eats has a wide global footprint and diverse plan options, exact costs can differ between markets and individual agreements. Grubhub Restaurant Commissions: Grubhub has been known to offer greater flexibility in commission rates. Some plans range from 5 % to 20 % for its marketplace option or a fixed lower rate for direct orders. Processing Fees: May include order processing charges that reduce net income.  Customer Fees: As with other platforms, delivery and service fees vary by region and time of day.  Payout Terms: Weekly or negotiated based on partnership agreements. Takeaway: Grubhub’s structure can be more flexible than others, especially for restaurants that bundle delivery with direct order services. Postmates (Now Integrated with Uber Eats) Restaurant Commissions: Since becoming part of the Uber Eats ecosystem, Postmates typically aligns with Uber Eats pricing structures. Customer Fees: Similar to Uber Eats, with variability based on market factors.  2. Are Delivery Platforms Always Cheaper for Customers There is no single cheapest food delivery app, as costs can vary greatly depending on the location, restaurant partnerships, and the specific items ordered. Real‑World Pricing Variability Data suggests that which app is cheapest depends heavily on location, restaurant partnerships, and the specific items ordered: A recent analysis found that Grubhub was the lowest‑cost option in most U.S. states when comparing popular fast‑food menu items. However, in some metropolitan areas and specific chains, DoorDash and Uber Eats can be cheaper. Overall, dynamic fees and promotions mean price comparison at checkout is the only way to know which is cheapest for a particular order. Why Costs Vary Menu prices: Restaurants may price items differently across platforms. Delivery & service fees: These can change with surge demand and time of day. Promotions & subscriptions: Loyalty programs may reduce or waive fees. Ultimately, order totals can vary significantly even for the same restaurant and the same meal, so customers should compare options before finalizing an order. 3. What Do Restaurants Actually Earn from Delivery Restaurants generally have lower profit margins on delivery orders than on dine‑in due to the added commissions and fees. Typical Profit Impact Most third‑party platforms charge 15 % to 30 % commission fees on delivery orders.  After additional processing and marketing fees, real net margins on delivery orders can shrink substantially, some industry analyses suggest margins fall to 5 %-10 %, much lower than typical dine‑in margins. This means that while delivery orders can boost sales volume and reach new customers, they often deliver less net profit compared to dine‑in sales. Negotiated Rates High‑volume restaurants may negotiate lower commission rates — for example, 18 % to 22 % — especially when they bring significant order volume to a platform.  Hidden and Indirect Costs Some industry analysts suggest that when factoring in all indirect costs such as payment processing, order handling, and channel marketing, the effective cost of delivery to a restaurant can exceed the advertised commission rate.  4. Restaurant Payout Frequency & Cash Flow Payout timing varies by platform and by merchant agreement: Weekly payouts are common. Accelerated or daily payouts may be available for an additional fee or as part of premium plans. Some services offer adjusted payout terms for high‑volume partners. Faster payout options can help restaurants manage cash flow but may come at a cost. 5. Marketing, Promotions

Read more
UI/UX design for business growth in 2026 featuring professionals working on user interfaces, smartphone mockups, wireframes, and growth trend graphs

UI UX Design Services for Business Growth in 2026

In 2026, users judge your business long before they speak to your team. They judge it by how your website, app, or digital product feels to use. If the experience is confusing, slow, or frustrating, they often leave permanently. This is why UI UX design services are no longer optional for businesses that want sustainable growth. UI and UX design directly influence conversions, customer retention, brand trust, and operational efficiency. Businesses that treat design as a strategic function outperform those that treat it as decoration. UI/UX Design From a Business Perspective UI and UX design are often discussed from a creative angle, but their real value lies in business impact. UX (User Experience) focuses on how users move through a product, complete tasks, and achieve goals. UI (User Interface) focuses on how those interactions look, feel, and respond visually. Professional ui and ux design services bring these two disciplines together to reduce friction, improve clarity, and guide users toward action. Practical UI/UX Experience That Drives Results At Qualix Solutions, UI/UX design is shaped by hands-on experience working with real products, real users, and real constraints. Our team designs interfaces for websites, mobile applications, SaaS platforms, and enterprise systems where usability directly affects revenue and adoption. This experience helps us design interfaces that solve problems instead of just following trends. Every design decision is tied to user behavior, technical feasibility, and measurable business outcomes. The Difference Between UI and UX Design A common question businesses ask is what is the difference between UI and UX design, especially when planning a new product. Difference Between UI and UX With Example Consider an online banking app: UX design defines how users check balances, transfer money, and manage accounts efficiently. UI design determines how buttons, colors, typography, and layouts make those actions clear and easy to use. Good UX without UI feels functional but dull. Good UI without UX looks attractive but frustrates users. Growth happens when both work together. Why UI/UX Design Matters More Than Ever in 2026 User expectations in 2026 are shaped by the best digital products they use daily. Anything below that standard feels broken. Strong ui ux design and development services help businesses achieve: Higher Conversions Clear flows, intuitive layouts, and reduced friction lead users toward decisions instead of confusing them. Better Retention Users stay with products that feel predictable and easy. UX builds habits; UI reinforces trust. Lower Support Costs Well-designed experiences reduce user errors, confusion, and support requests. Stronger Brand Credibility Professional design signals reliability and attention to detail without saying a word. What Does a UX/UI Designer Actually Do Many stakeholders still ask, what is a ux/ui designer and what value they bring. A professional ux ui designer is responsible for: Understanding user needs and behavior Designing user journeys and interaction flows Creating wireframes and prototypes Collaborating with developers and product teams Testing and refining designs based on real feedback Experienced ui and ux designers balance user needs, business goals, and technical constraints throughout the product lifecycle. UI/UX Design Trends Shaping Business Growth in 2026 The design trends for 2026 are shifting the focus away from visual novelty and placing more emphasis on usability and performance. As businesses evolve, it’s becoming increasingly clear that effective user interfaces (UI) and experiences (UX) are no longer just about looking good—they need to work well and perform seamlessly. Key UI/UX design trends include: Simpler Interfaces with Fewer Distractions: In 2026, there is a growing emphasis on creating minimalist designs that eliminate unnecessary elements. This approach enhances the user experience by allowing users to focus on essential tasks without being distracted by extraneous content or features. Accessibility-First Design for Broader User Reach: Accessibility has become a top priority, with more businesses designing products that cater to a wide range of users, including those with disabilities. By incorporating accessibility features, businesses can ensure a more inclusive digital experience and expand their reach to a broader audience. Data-Driven UX Decisions: Making informed design choices based on real user data is a crucial trend. Businesses are increasingly relying on data analytics to understand user behavior and optimize their designs for maximum engagement and satisfaction. Consistent Experiences Across Devices: The need for a seamless experience across multiple devices is a priority. Whether users are accessing a website on a desktop, smartphone, or tablet, ensuring consistency in design and functionality is key to keeping them engaged. Performance-Focused Layouts That Load Fast: Fast load times are critical in retaining users. Performance-driven design ensures that websites and applications load quickly, reducing bounce rates and improving user satisfaction. In conclusion, trends matter only when they contribute to usability. Design choices made without a clear purpose rarely deliver tangible results, making it essential to prioritize functionality and performance over aesthetics alone. The Role of Figma in Modern UI/UX Design Collaboration is critical in modern product teams. Figma for UI/UX design has become widely adopted because it supports real-time collaboration between designers, developers, and stakeholders. Figma helps teams prototype quickly, maintain consistent design systems, share feedback instantly and reduce gaps between design and development Using the right tools improves both speed and design quality. UI/UX Design Services vs DIY Design Approaches Some businesses rely on templates or internal teams to save costs. While this can work short term, it often limits scalability. Professional ux/ui design services provide: Research-driven design decisions Custom solutions aligned with business goals Scalable design systems Designs that translate cleanly into development DIY approaches often lead to usability issues that surface only after launch, when fixing them becomes expensive. UI and UX Design Services for Different Business Stages Different business stages require different design strategies. Startups Startups benefit from UX-focused MVPs that validate ideas quickly and avoid unnecessary features. Growing Businesses Scaling companies need consistent design systems that work across products and platforms. Enterprises Large organizations rely on ui ux design and development services to manage complex workflows, security requirements, and large user bases. Custom design adapts to business complexity rather than forcing businesses into rigid

Read more
Contact us

Partner with Us for Comprehensive IT

We’re happy to answer any questions you may have and help you determine which of our services best fit your needs.

Your benefits:
What happens next?
1

We Schedule a call at your convenience 

2

We do a discovery & consulting meeting 

3

We prepare a proposal 

Schedule a Free Consultation